Stop bouncing between tools at 2am. Qorrelate shows you what's happening across your stack so your team spends less time debugging and more time shipping.
We built this because we hated the old way as much as you do.
Choose your setup method. Most teams are sending data within 5 minutes.
Choose from OpenTelemetry, AI Agent, CLI, or Docker. Most teams are sending data within 5 minutes.
Point your existing OpenTelemetry collector to Qorrelate.
exporters:
  otlphttp:
    endpoint: "https://otel.qorrelate.io"
    headers:
x-qorrelate-api-key: "YOUR_API_KEY"Your telemetry flows automatically. No code changes required for most setups. See logs, traces, and metrics appear in real-time.
Your AI now has 150+ tools to help you debug issues, create alerts, analyze costs, and understand your system. Connect your GitHub account to let the AI search your source code and investigate stack traces automatically. Just ask.
From startups to scale-ups, we're built for teams that move fast.
Perfect for 10-100 engineers
Scale your observability without scaling your costs. Built-in cost controls keep spending predictable.
Perfect for 1-10 engineers
Get enterprise-grade observability without the enterprise price tag. Start free, scale as you grow.
Perfect for 100+ engineers
Self-host on your infrastructure or use our managed service. Full control, zero vendor lock-in.
Designed to fit naturally into the tools post-MVP SaaS teams already use.
Our case studies show real value.
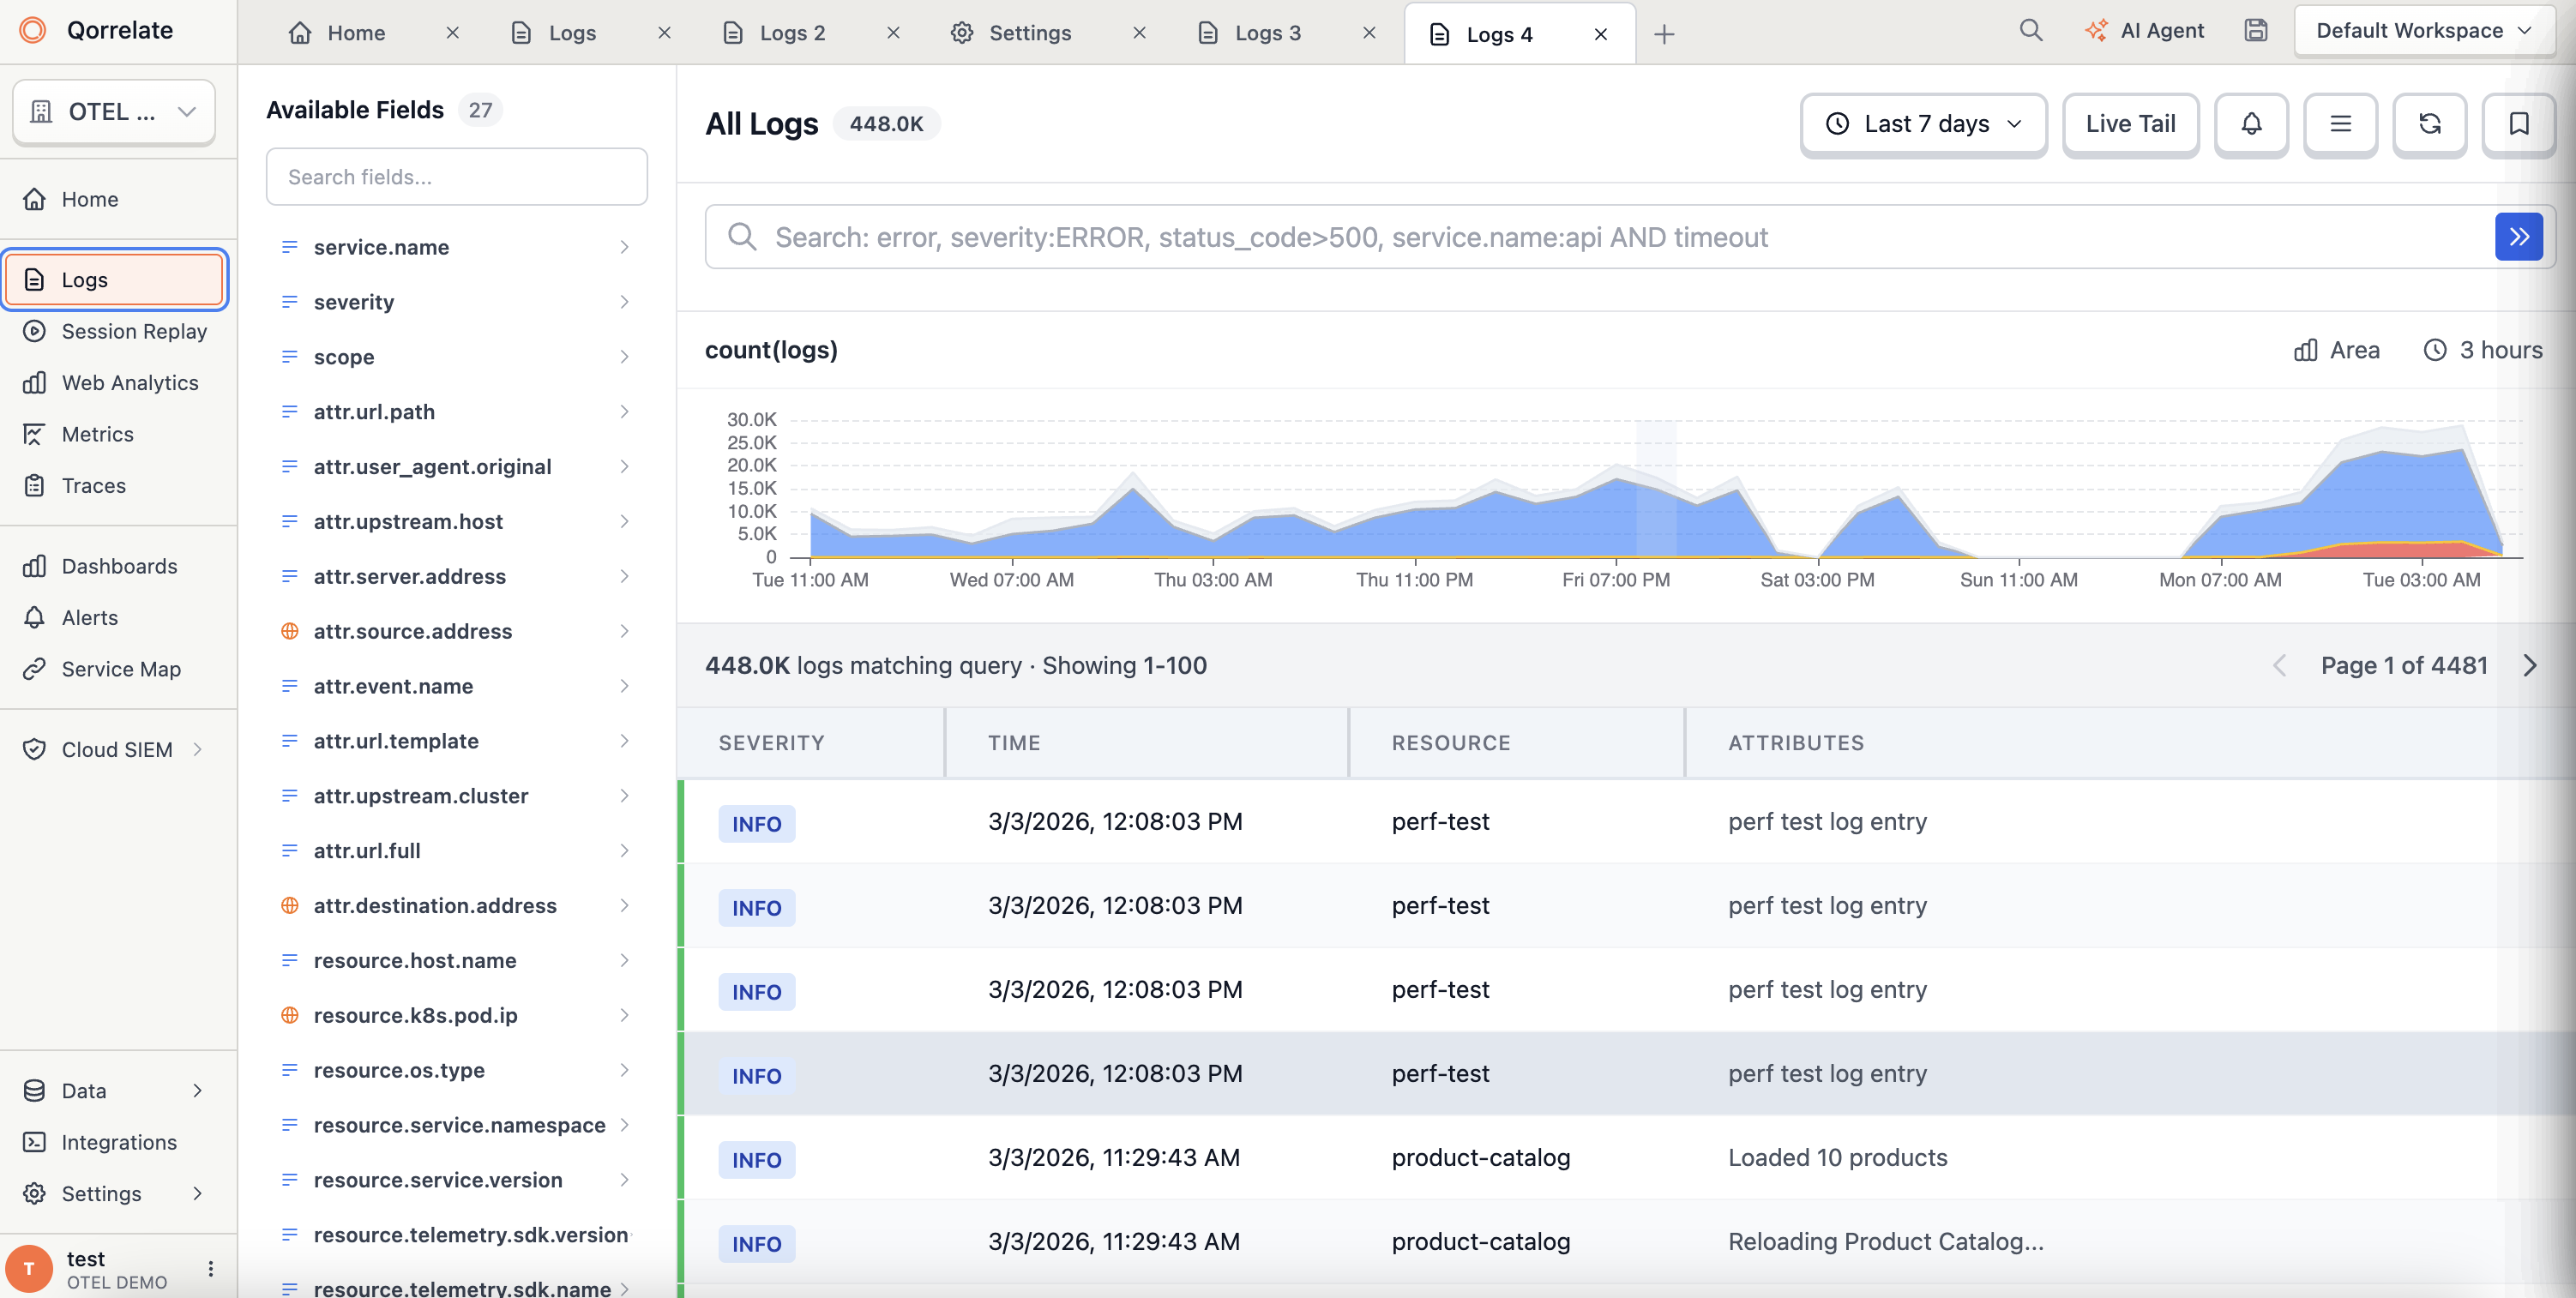
Search billions of log lines in seconds. Powerful full-text search, real-time tail, and smart grouping help you find the needle in the haystack.
Free tier to start, then pay only for what you use. No per-host fees.
Logs
Metrics
Trace Spans
Send us your OpenTelemetry data. We'll store it in ClickHouse for a fraction of what you're paying now.
Our team is here to help! Send us your question and we'll get back to you as soon as possible.
Tell us a bit about you and your company. We will send a confirmation to your work email and open the interactive demo with real OpenTelemetry data.