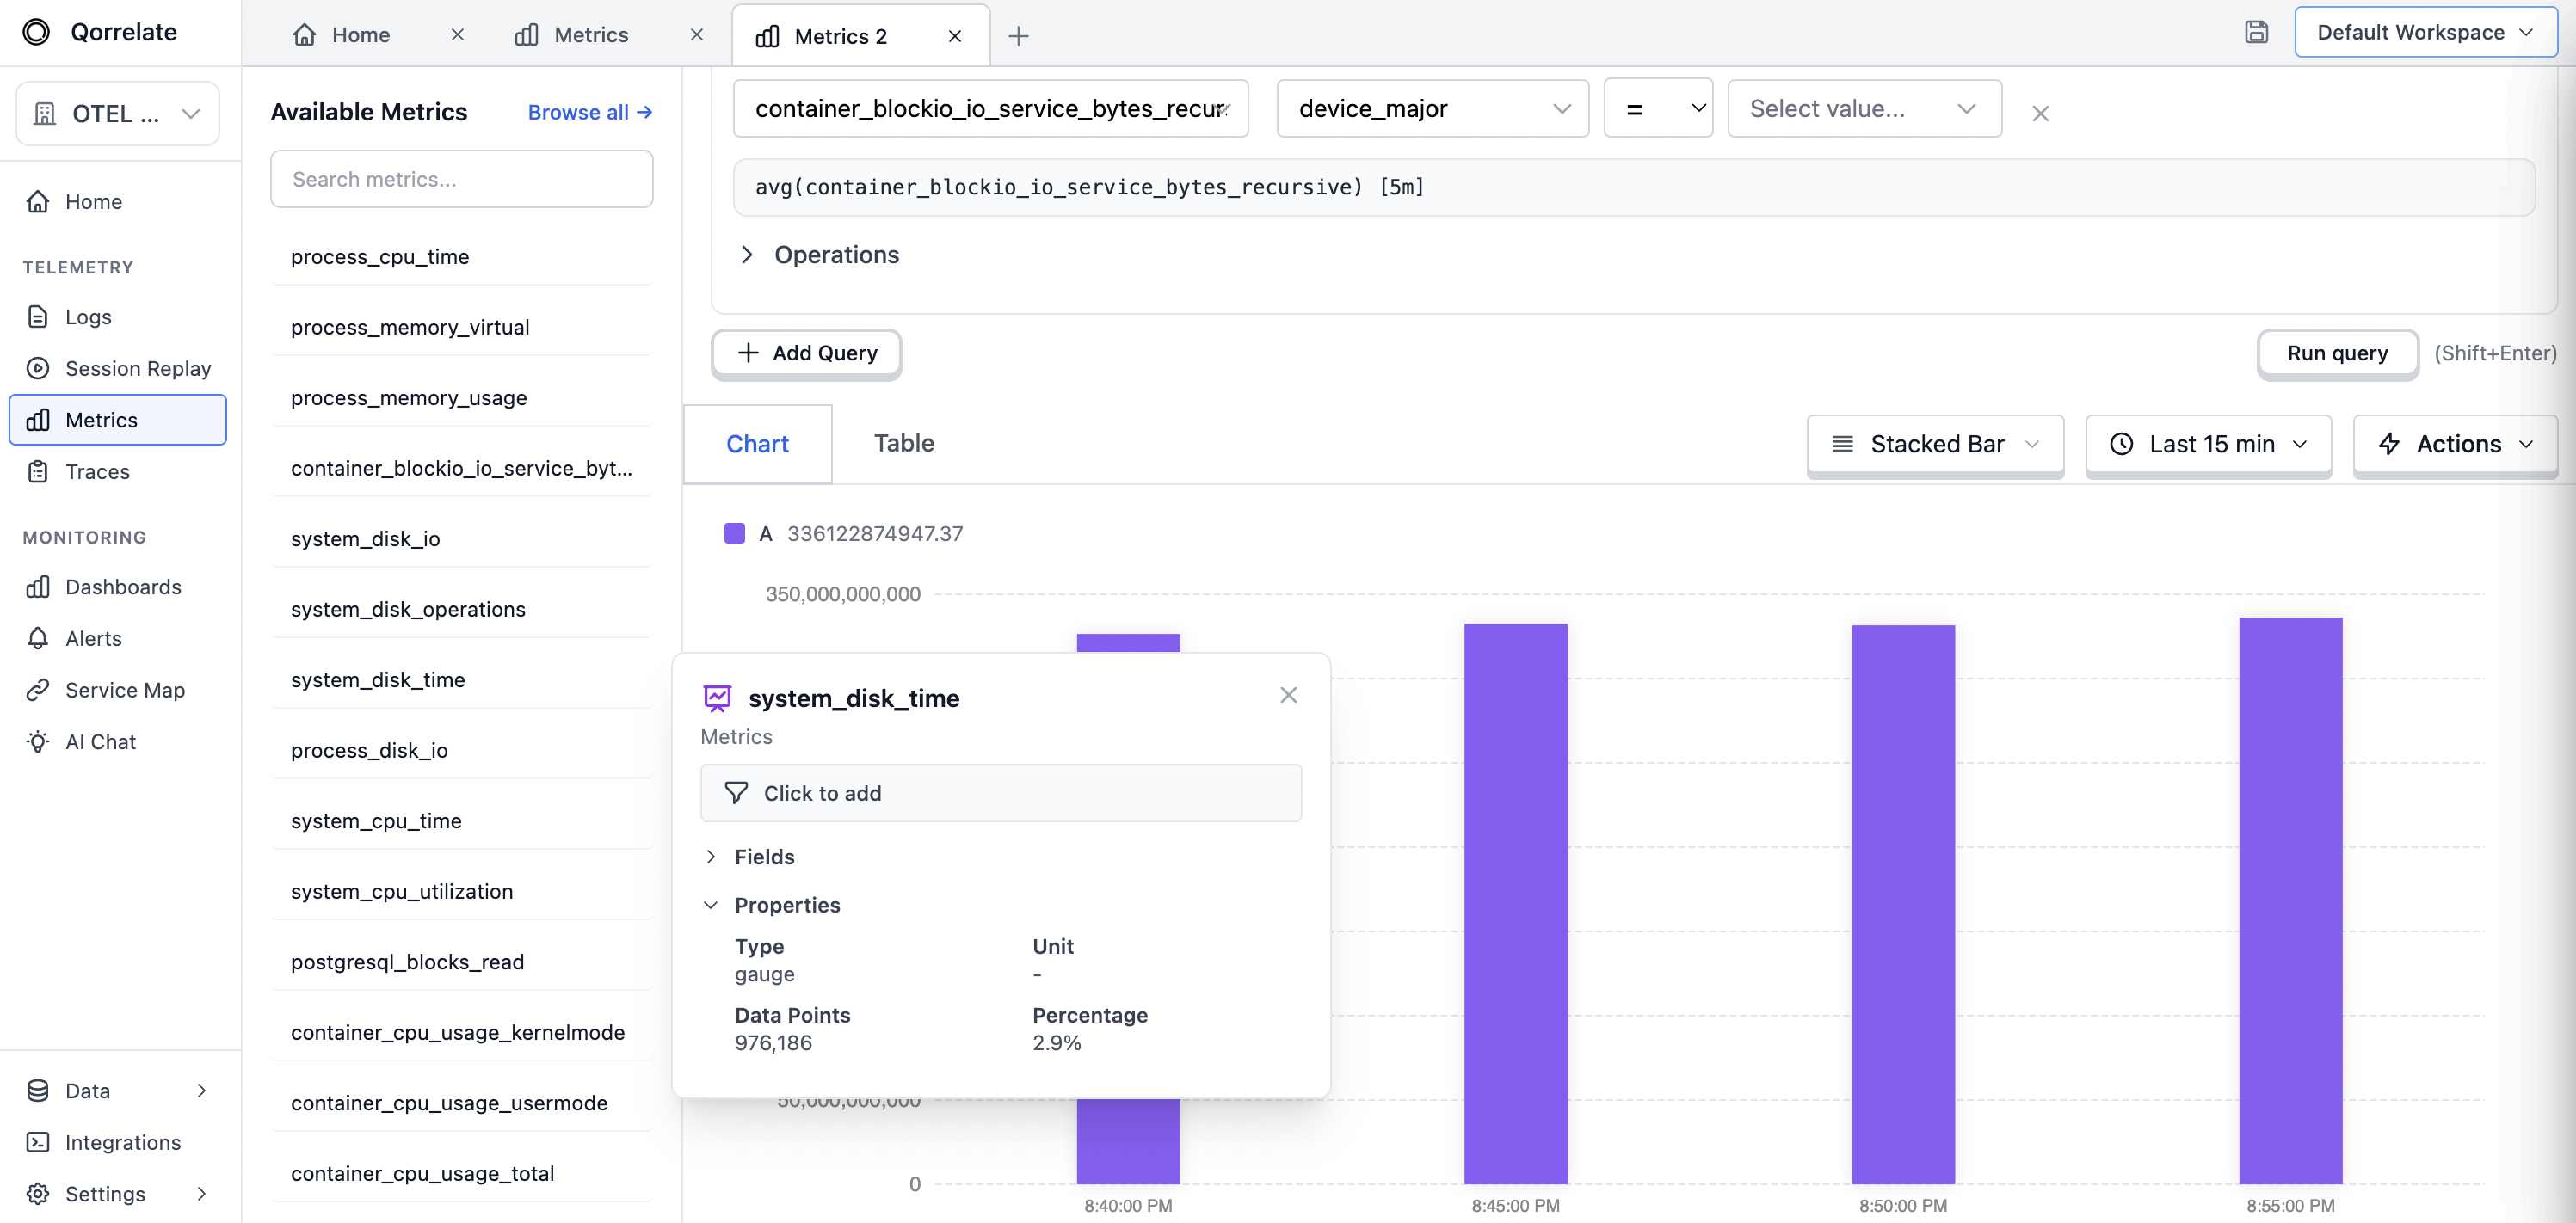
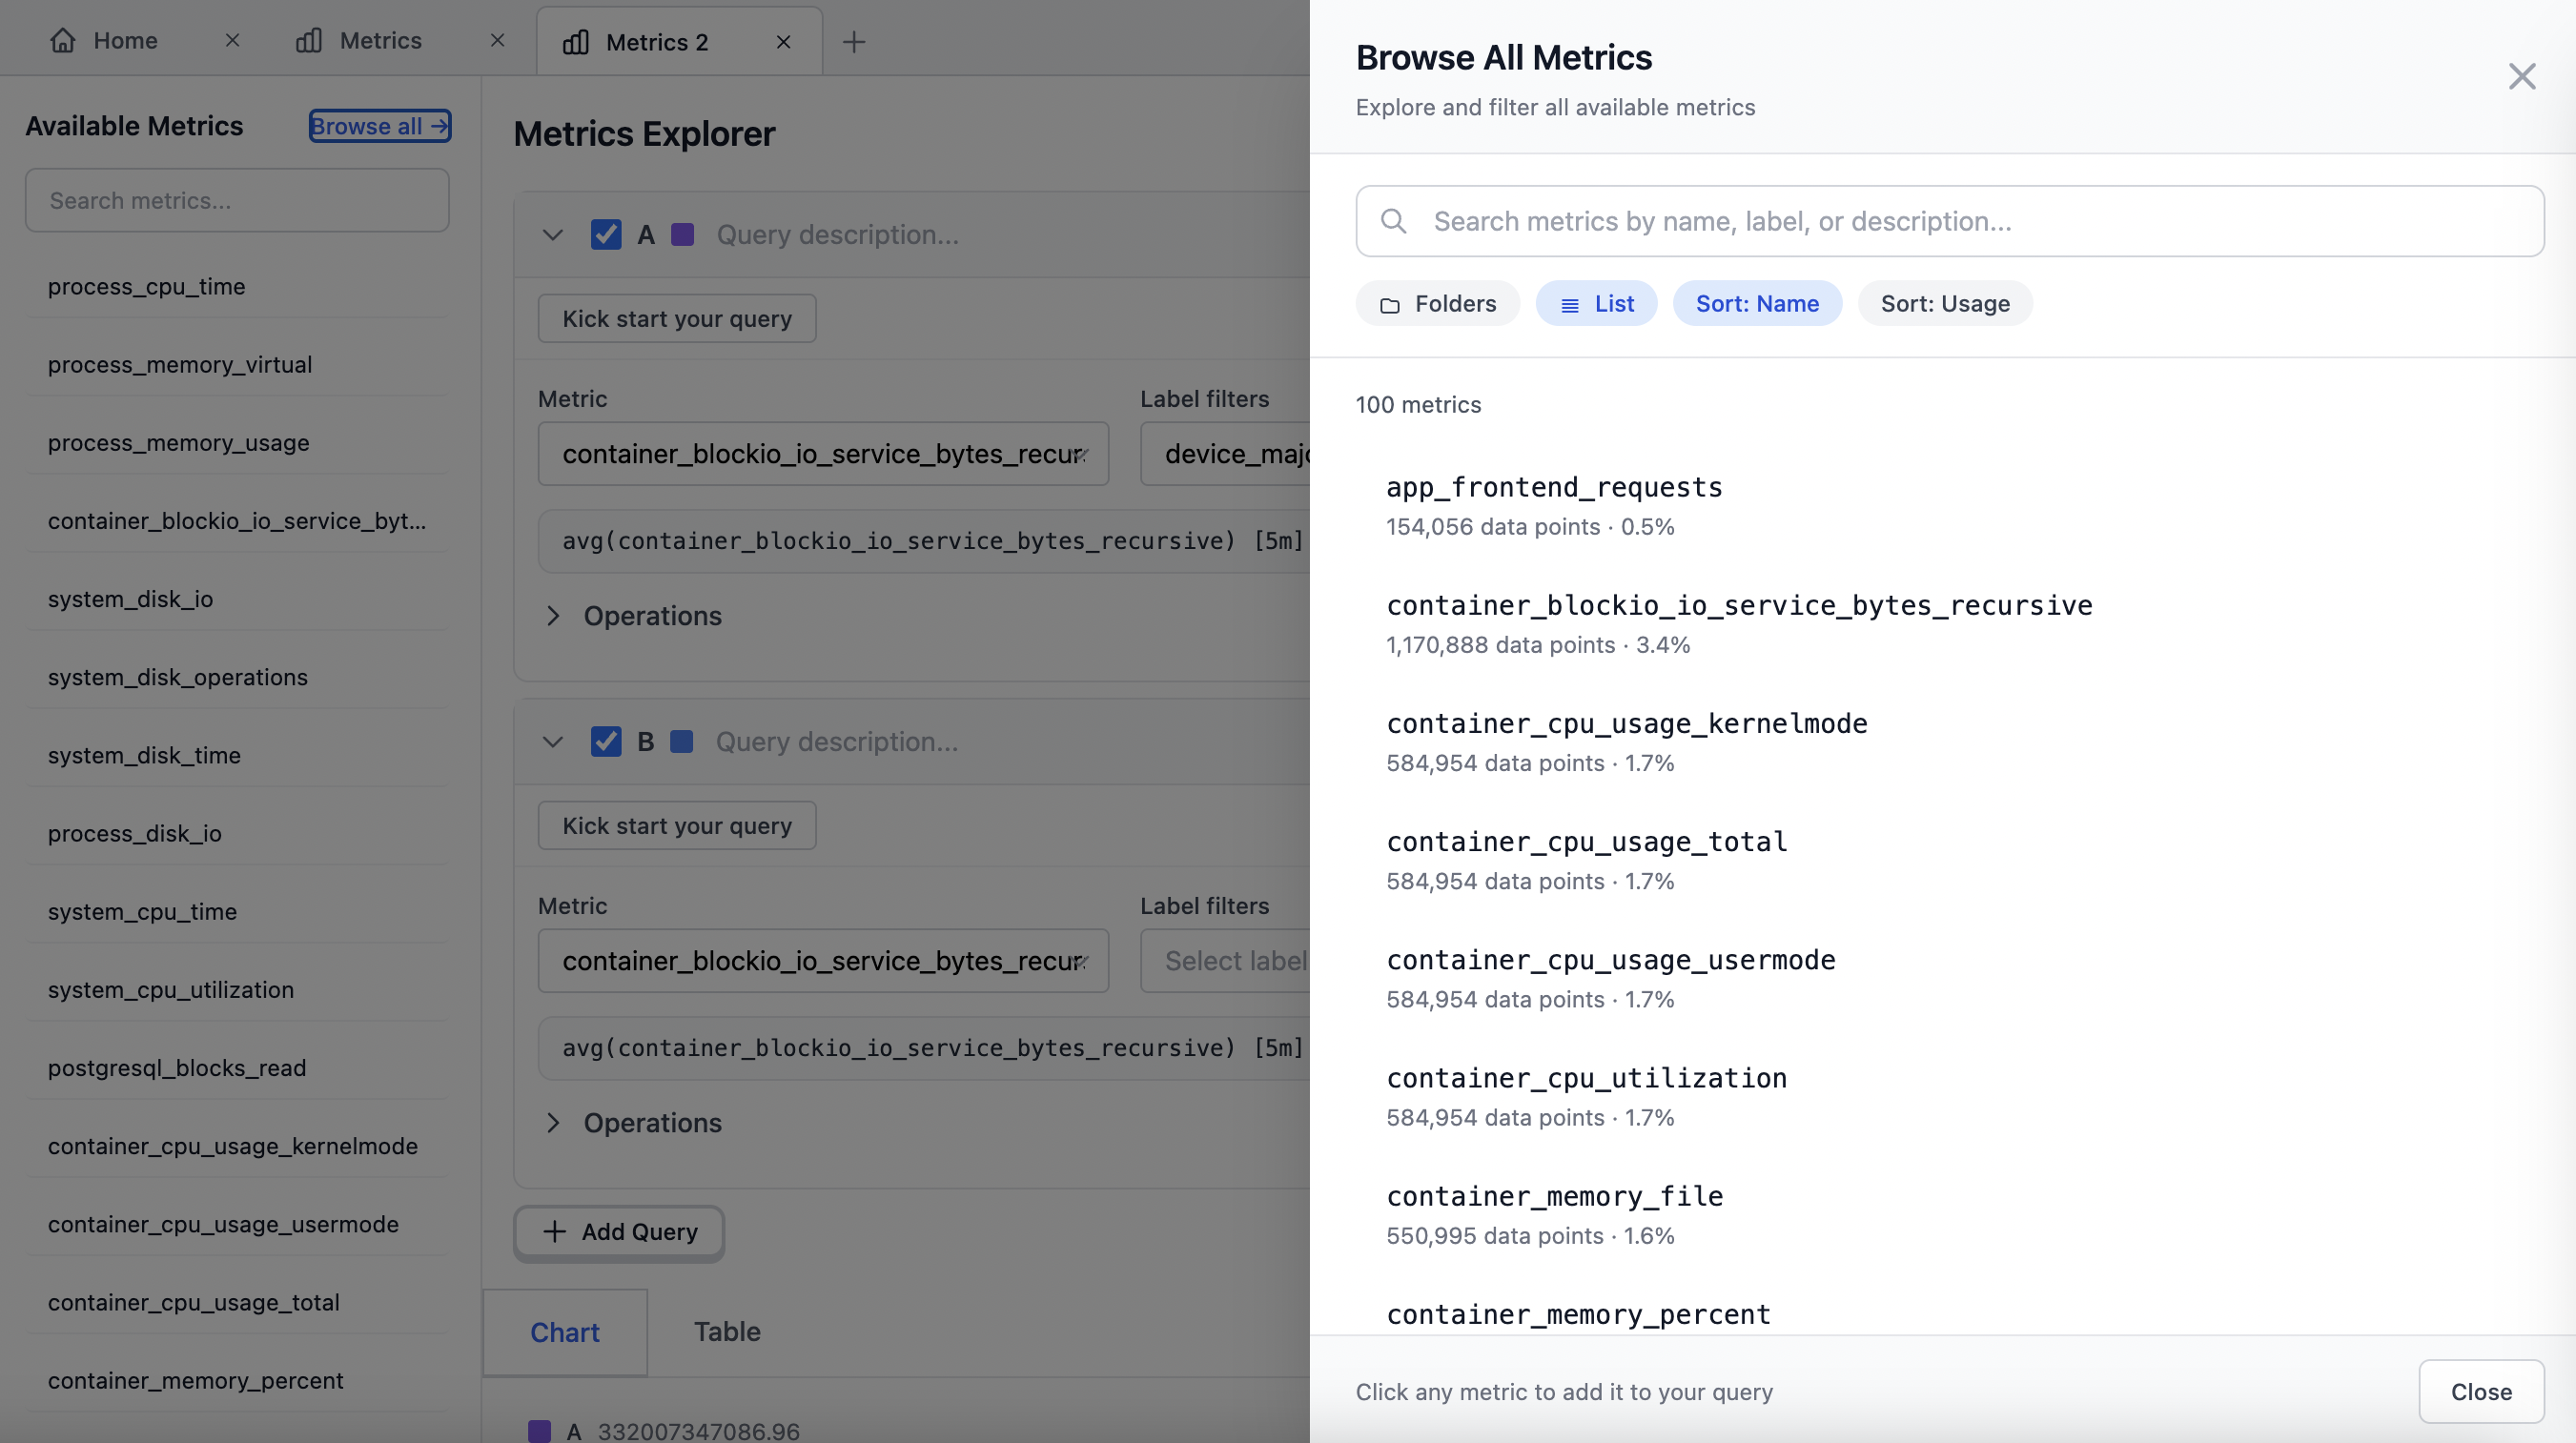
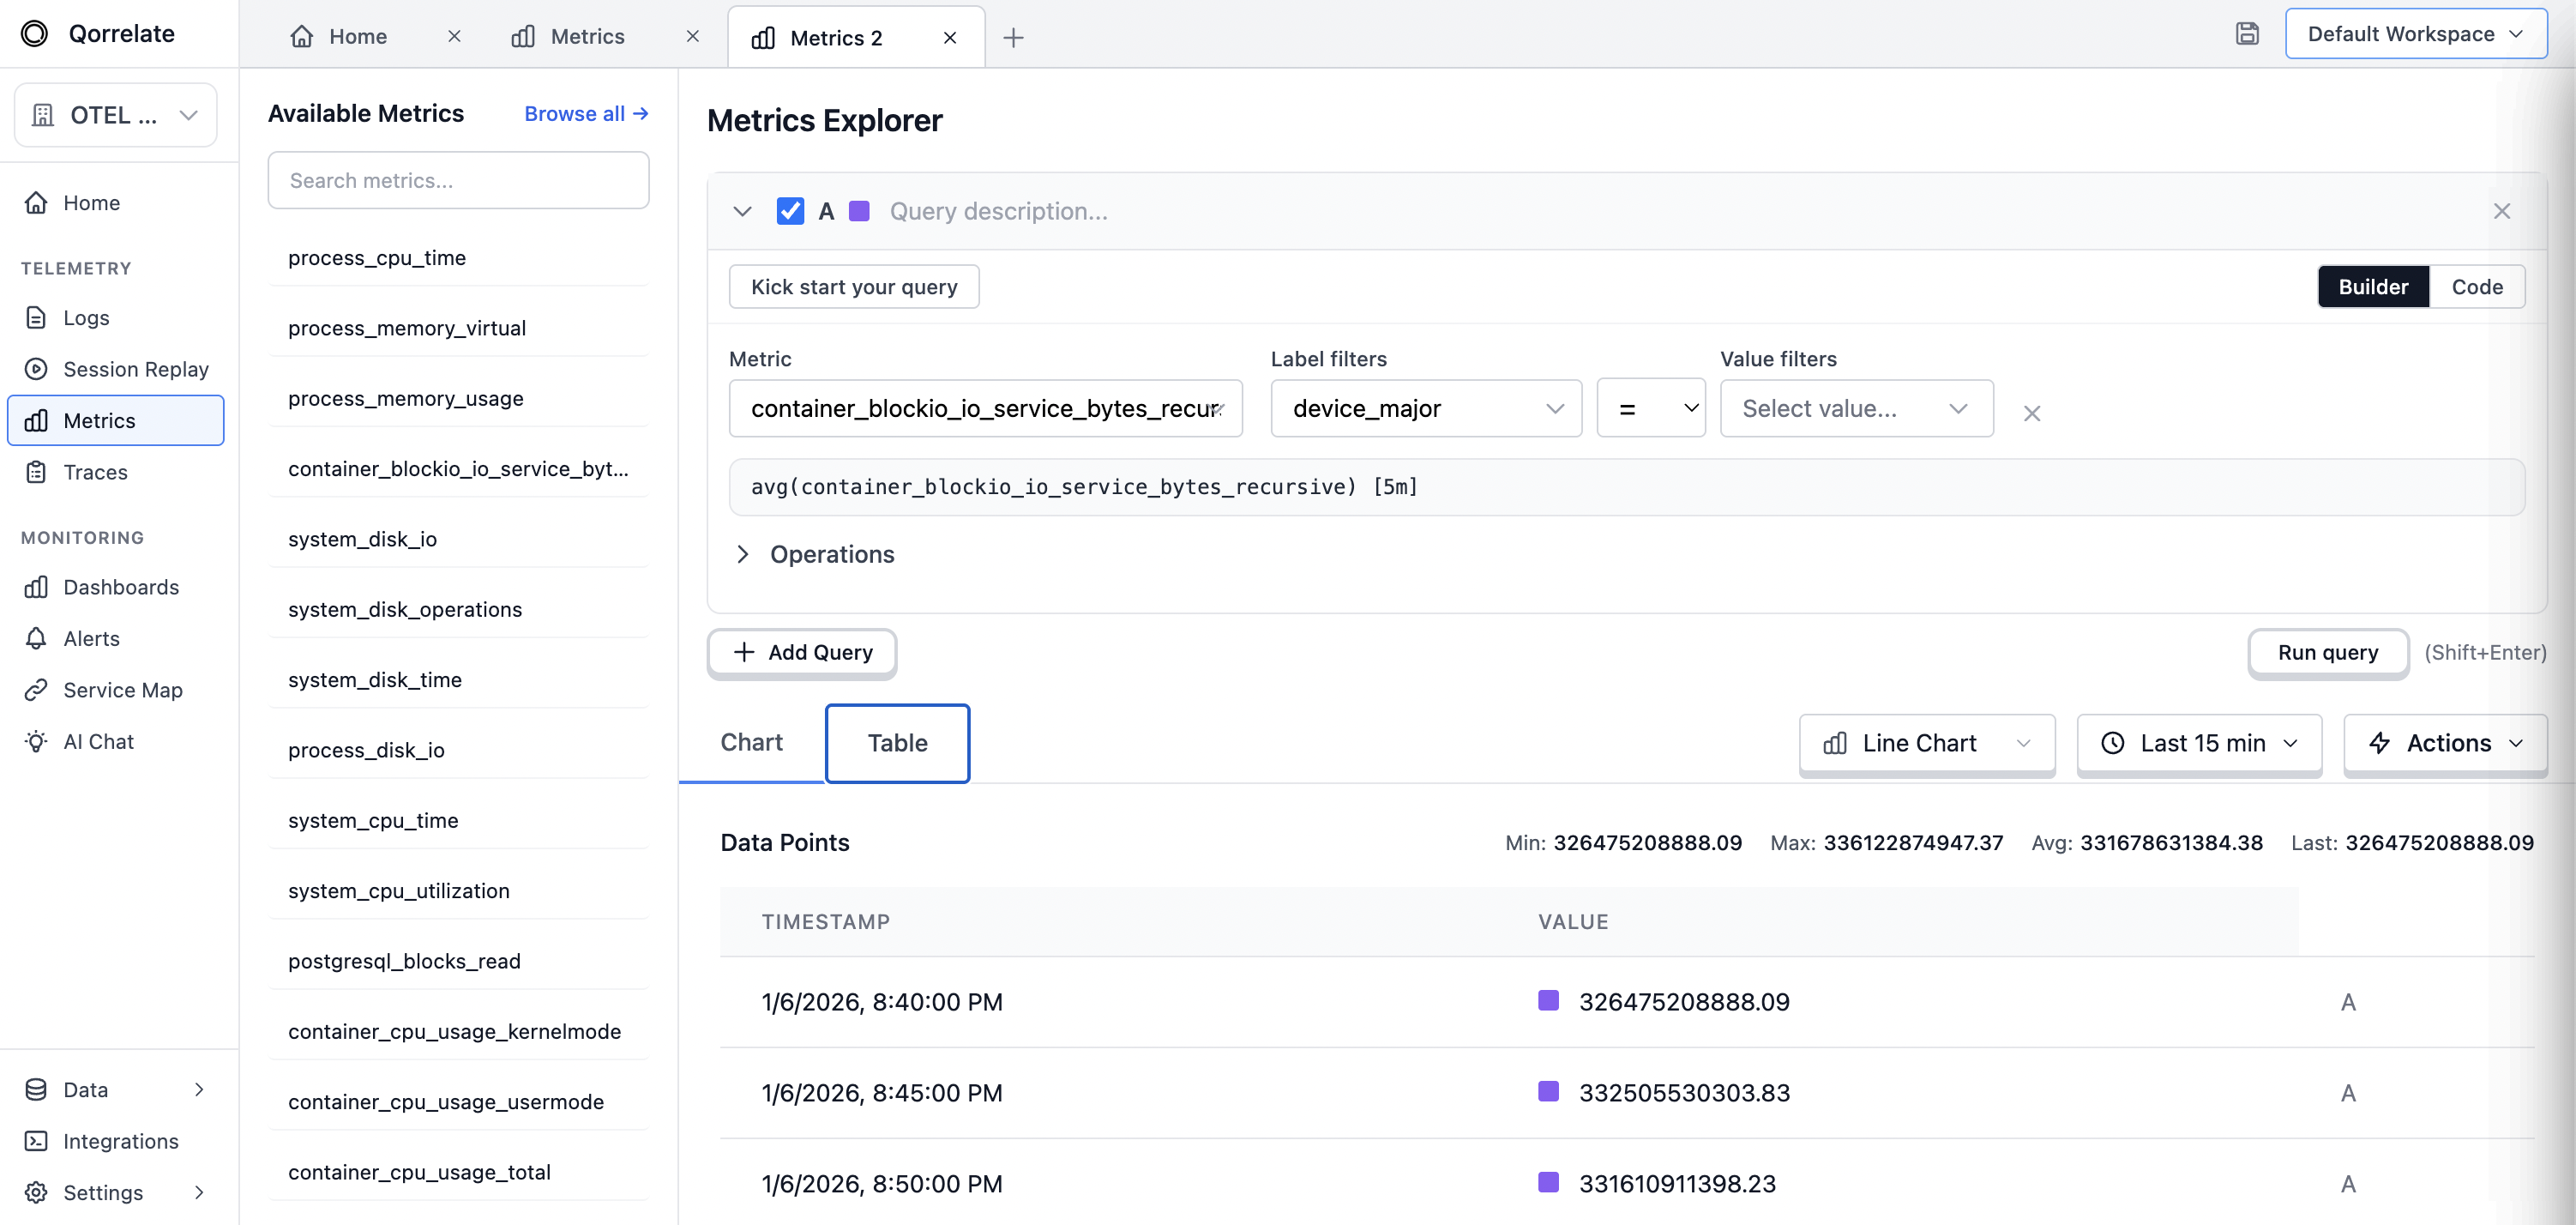
Collect, store, and visualize metrics from all your systems. High-cardinality support, long-term retention, and blazing-fast queries at any scale.
Unlimited Cardinality
Track metrics with millions of unique label combinations without performance degradation or surprise costs. High cardinality is a feature, not a problem.
PromQL Compatible
Full PromQL compatibility means your existing dashboards, alerts, and workflows work out of the box. Zero learning curve for Prometheus users.

Long-Term Retention
Intelligent tiering automatically moves older data to cost-effective storage while keeping it instantly queryable.
Full Correlation
See a latency spike? Click through to the exact traces that caused it. Correlate metrics with logs and traces to get the complete picture.

Free to start. No credit card required. High cardinality, long retention, instant queries.